


JavaScript is a programming language used to develop dynamic and interactive websites. There are over 1.8 Billion websites in the world, and JavaScript is used on 95% of them. I have compiled the best and useful Chart Libraries that you need as a Javascript developer. The JavaScript Chart Libraries helps you easily visualize data using JavaScript
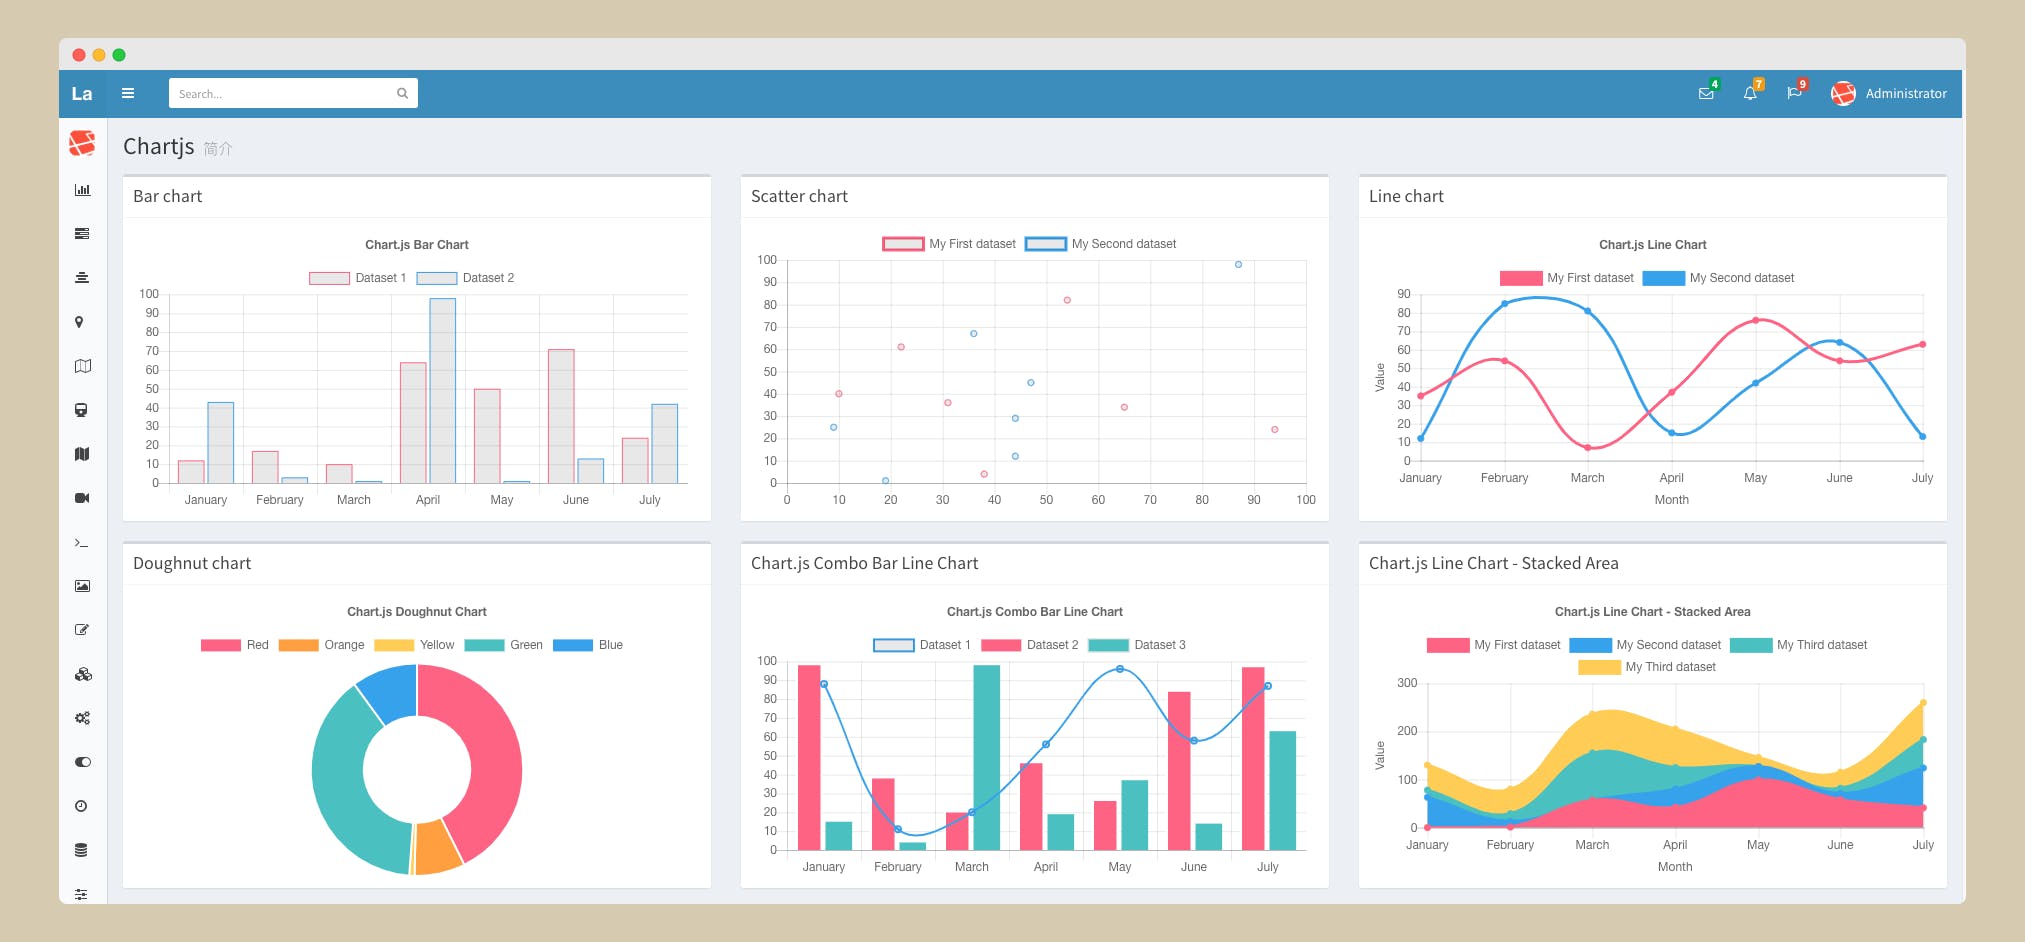
ChartJS
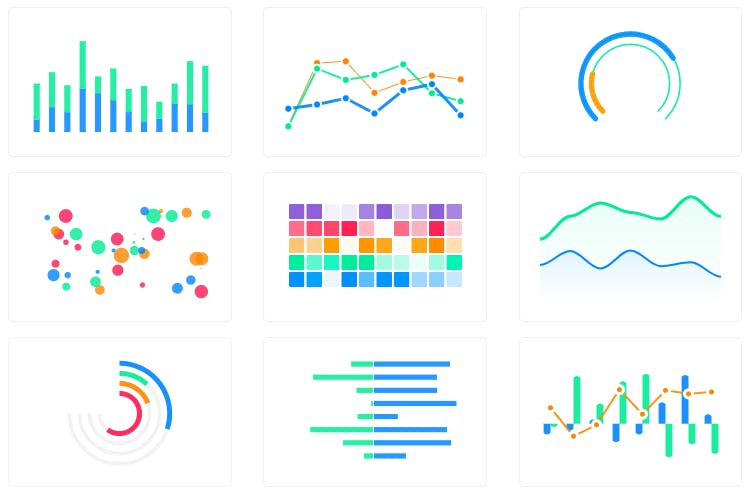
Simple, clean and engaging HTML5 based JavaScript charts. Chart.js is an easy way to include animated, interactive graphs on your website for free. It is a community maintained an open-source library that helps you easily visualize data using JavaScript.
 link: ChartJS
Data Driven Documents (D3)
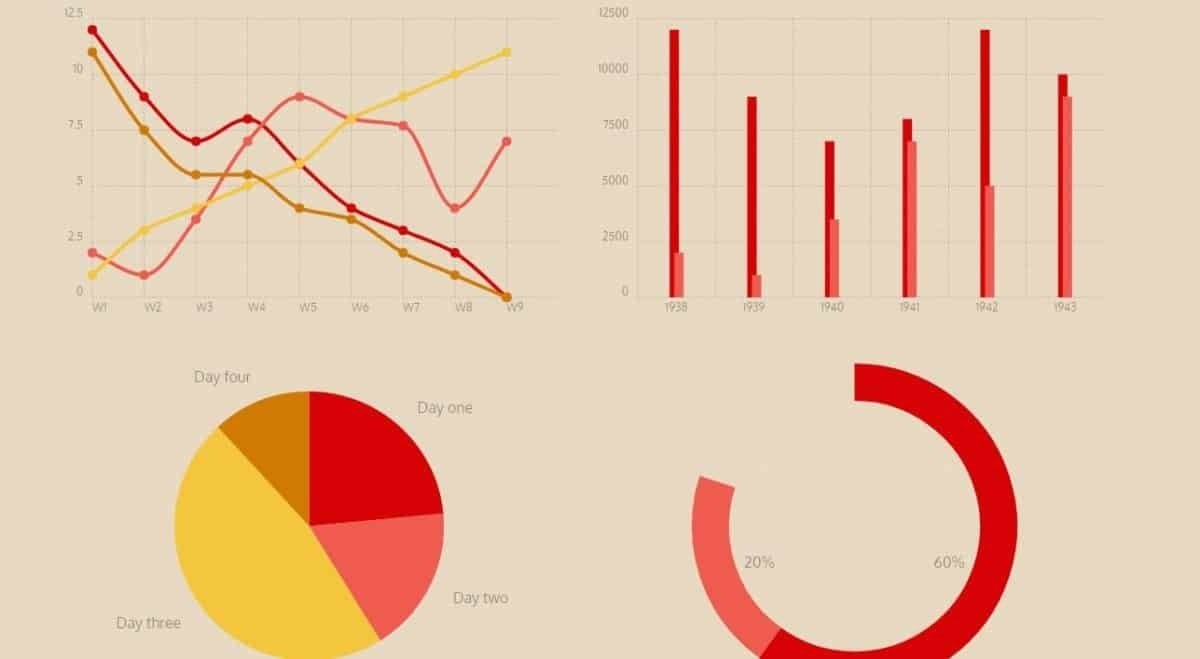
D3.js is a JavaScript library for producing dynamic, interactive data visualizations in web browsers. It makes use of Scalable Vector Graphics, HTML5, and Cascading Style Sheets standards.
 Link: D3
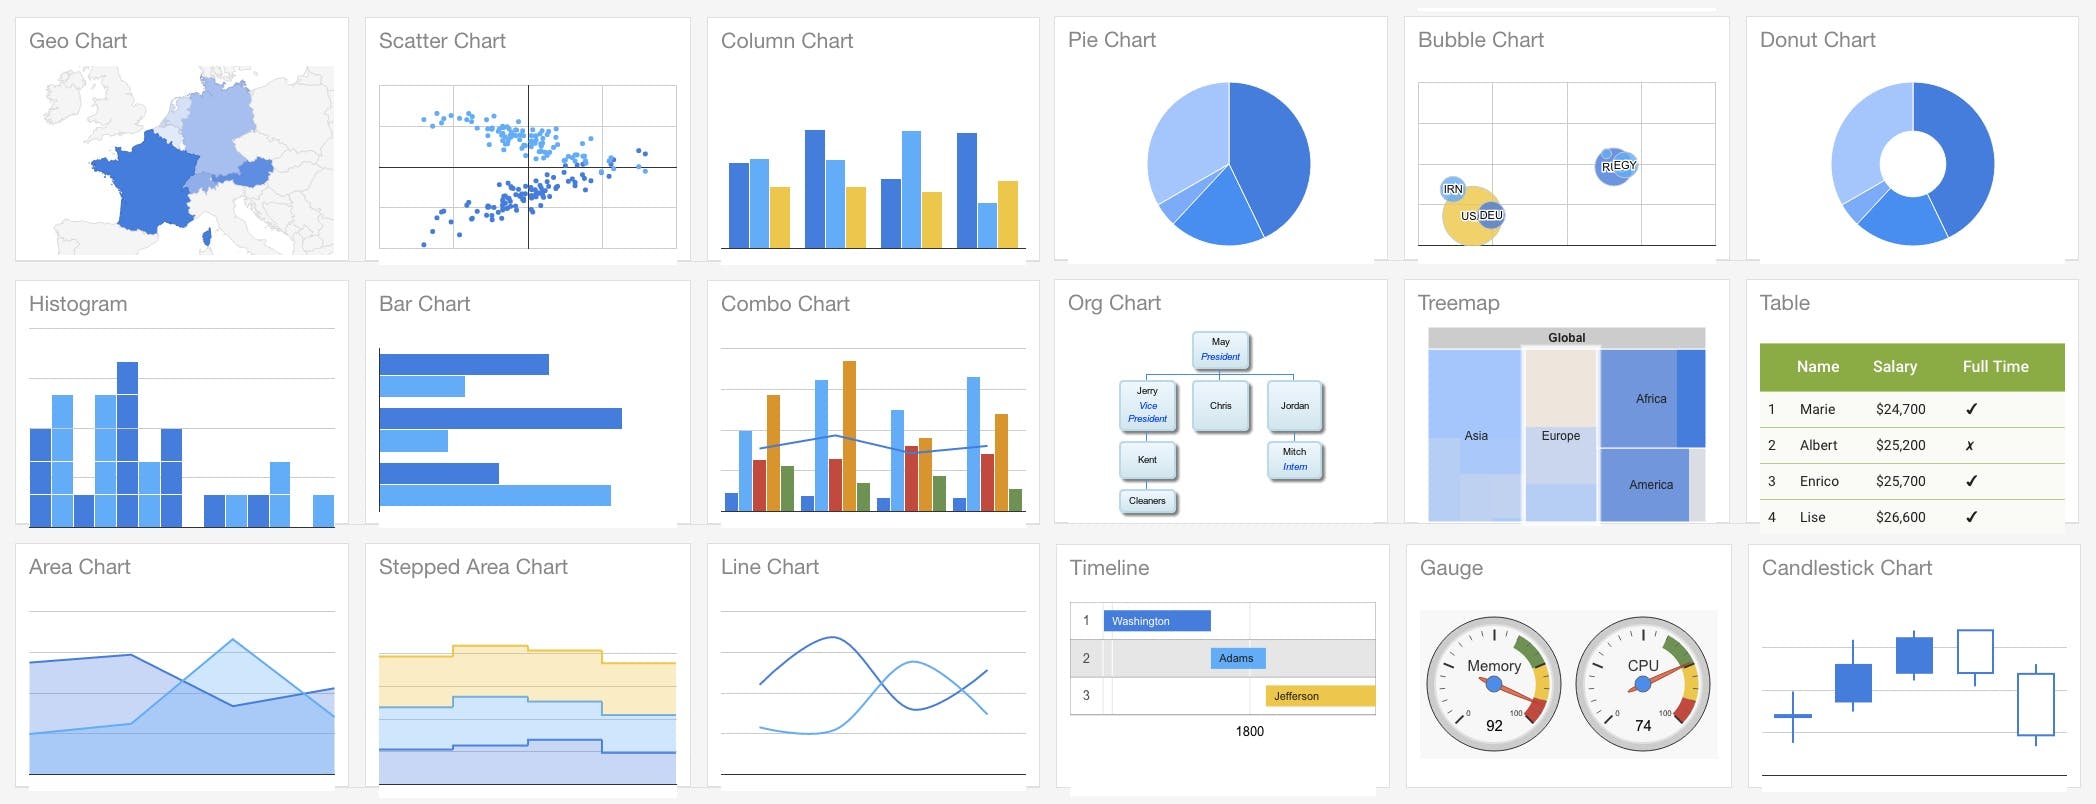
Google Charts
Google Charts is an interactive Web service that creates graphical charts from user-supplied information. The user supplies data and a formatting specification expressed in JavaScript embedded in a Web page; in response, the service sends an image of the chart.
Link: Google Charts
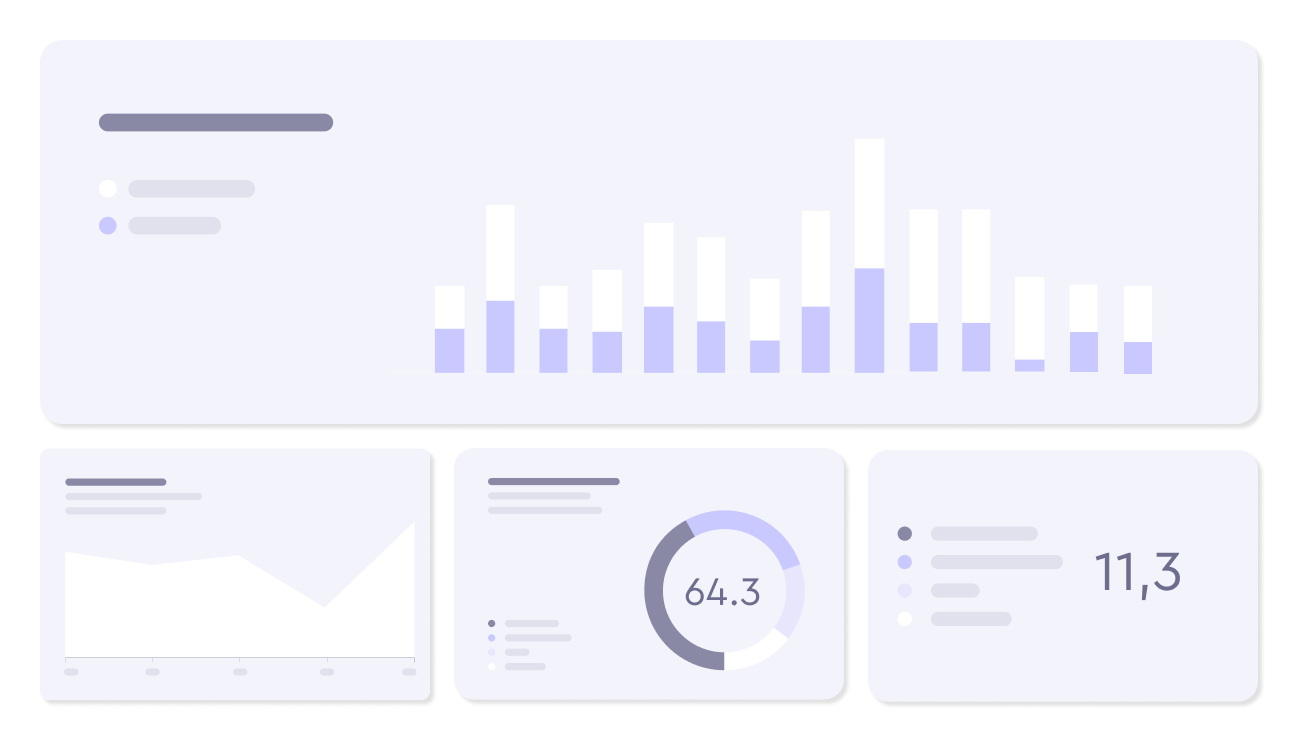
ApexCharts.Js
ApexCharts is a free and open-source modern charting library that helps developers to create beautiful and interactive visualizations for web pages. This library allows you to build interactive data visualizations with simple API and 100+ ready-to-use samples.
 Link:ApexCharts
Chartist
Chartist JS is a simple, flexible way to visualize so many types of data, it is developed to create simple responsive charts.
Link: Chartist
G2Plot
G2Plot is an interactive and responsive charting library based on the grammar of graphics. The responsive ability of g2plot guarantee your chart's readability in any display space and data status.
Link: G2Plot
Thanks for reading, I hope you found this useful.
Feel free to connect with me on Twitter